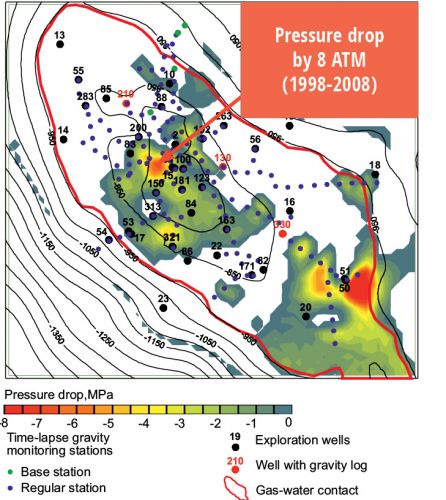
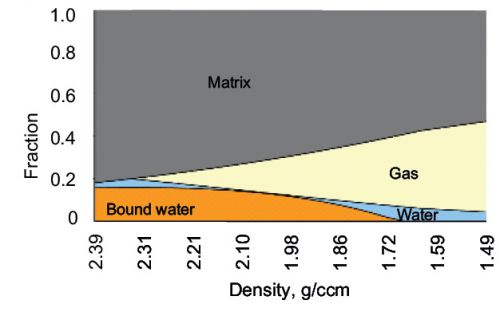
DEPROIL - Your Partner in Complex Geological Settings

Examples

MAPPING PRESSURE DROP AND FLOODING AREAS BASED ON THE RESULTS OF TIME-LAPSE GRAVIMETRIC OBSERVATIONS AND BOREHOLE GRAVIMETRY (4D+1D)

Nadym-Pur, Western Siberia,
Russian Federation
Time lapse gravity survey:
1998-2008


Figure 1. Pressure change in Cenomanian gas pool after 10 years of production

GEOLOGICAL PROBLEM

Monitoring of waterflooding in the main gas pool - Cenomanian, Cretaceous, К1-2pk

Seismic monitoring not an option due to the absence of a seismic signal above the structure

Study of more shallow pool in Berezov Formation, Senonian, Upper Cretaceous, К2br

GEOLOGICAL RESULTS

Local areas of pressure drop by 5-6 МPa and gas-saturation change after 10 years of production were identified

Predicted location of well clusters with gas-water contact rise and pressure drop

  Predicted gas-saturated pool in Senonian formation

 
Figure 2. Dependency of Cenomanian rock density on porosity, water- and gas-saturation

Figure 3. Dependency of gas density on preassure and temperature in Cenomanian gas-saturated sandstones

Figure 4. Cross-section of 3D density model through the wells with gravity log

Figure 5. Cross-section of 3D gas-saturation model through the wells with gravity log


3D GTAVITY INVERSION WORKFLOW

Structural framework of the model was built using 2D & 3D seismic data interpretation, including target Cenomanian and Senonian horizons of Upper Cretaceous. Wells were used to define the initial 3D  density model of target Cenomanian intervals (Upper Cretaceous, K2). 3D density model was refined by joint 3D linear inversion of surface gravity field and well log gravity data with one-meter resolution in depth (Figure 6). We used surface background measurements of 1998 and measurements after a decade of production of 2008.

3D model of gas saturation (Figure 5) was built using the dependency of Cenomanian rock density on porosity and saturation (Figure 2). The dependency of real gas density on pressure and temperature was derived (Figure 3) as well as the dependency of Cenomanian gas- saturated sandstone’s density on porosity and gas saturation (Figure 2). Gas saturation decrease was detected in the marginal part of the gas pool which is associated with contour water flood within highly permeable beds (Figure 5). In the apical part of the structure, there is a zone of abnormal pressure drop (Figure 1). New gas-saturated pool was mapped in Cenonian formation of Upper Cretaceous (Figure 4).


Figure 6. High-resolution (1m in depth) 3D density models of gas-saturated pool by joint gravity field and gravity log inversion: background model (1998, left) and model after 10 years of  production (2008, right)

PUBLICATIONS

1.  Федченко Т.А., Облеков Г.И., Полын И.И., Нежданов А.А., Огибенин В.В. Оптимальный комплекс геолого-геофизических исследований для изучения нефтегазоносных территорий на примере Надым-Пуровского нефтегазопромыслового района. Вопросы теории и практики геологической интерпретации гравитационных, магнитных и электрических полей. (Материалы XXXVI сессии международного семинара им. Д.Г.Успенского) Казань, 26-31 января 2009г.. -С. 252-255.


News


UKRAINE GAS INVESTMENT CONGRESS 2021
20/10/21
DEPROIL LTD sponsored and participated in the Ukrainian Gas Investment Congress. CEO professor Oleksandr Petrovskyy made a report "Gas Production Breakthrough in Ukraine - Technological and Geological Prerequisites to Succeed" underscoring the beggining of the new paradigm in gas and oil fields... » Read more

?>